Group rows into one document
Data grouping combines multiple rows from the same source into a single output document. It's how a sheet with one row per product line becomes one invoice per customer, with all the products listed in a table inside it.
This is the canonical guide. Source-specific recipes (Google Sheets, Webhooks, HubSpot) link back here.
When you'd use it
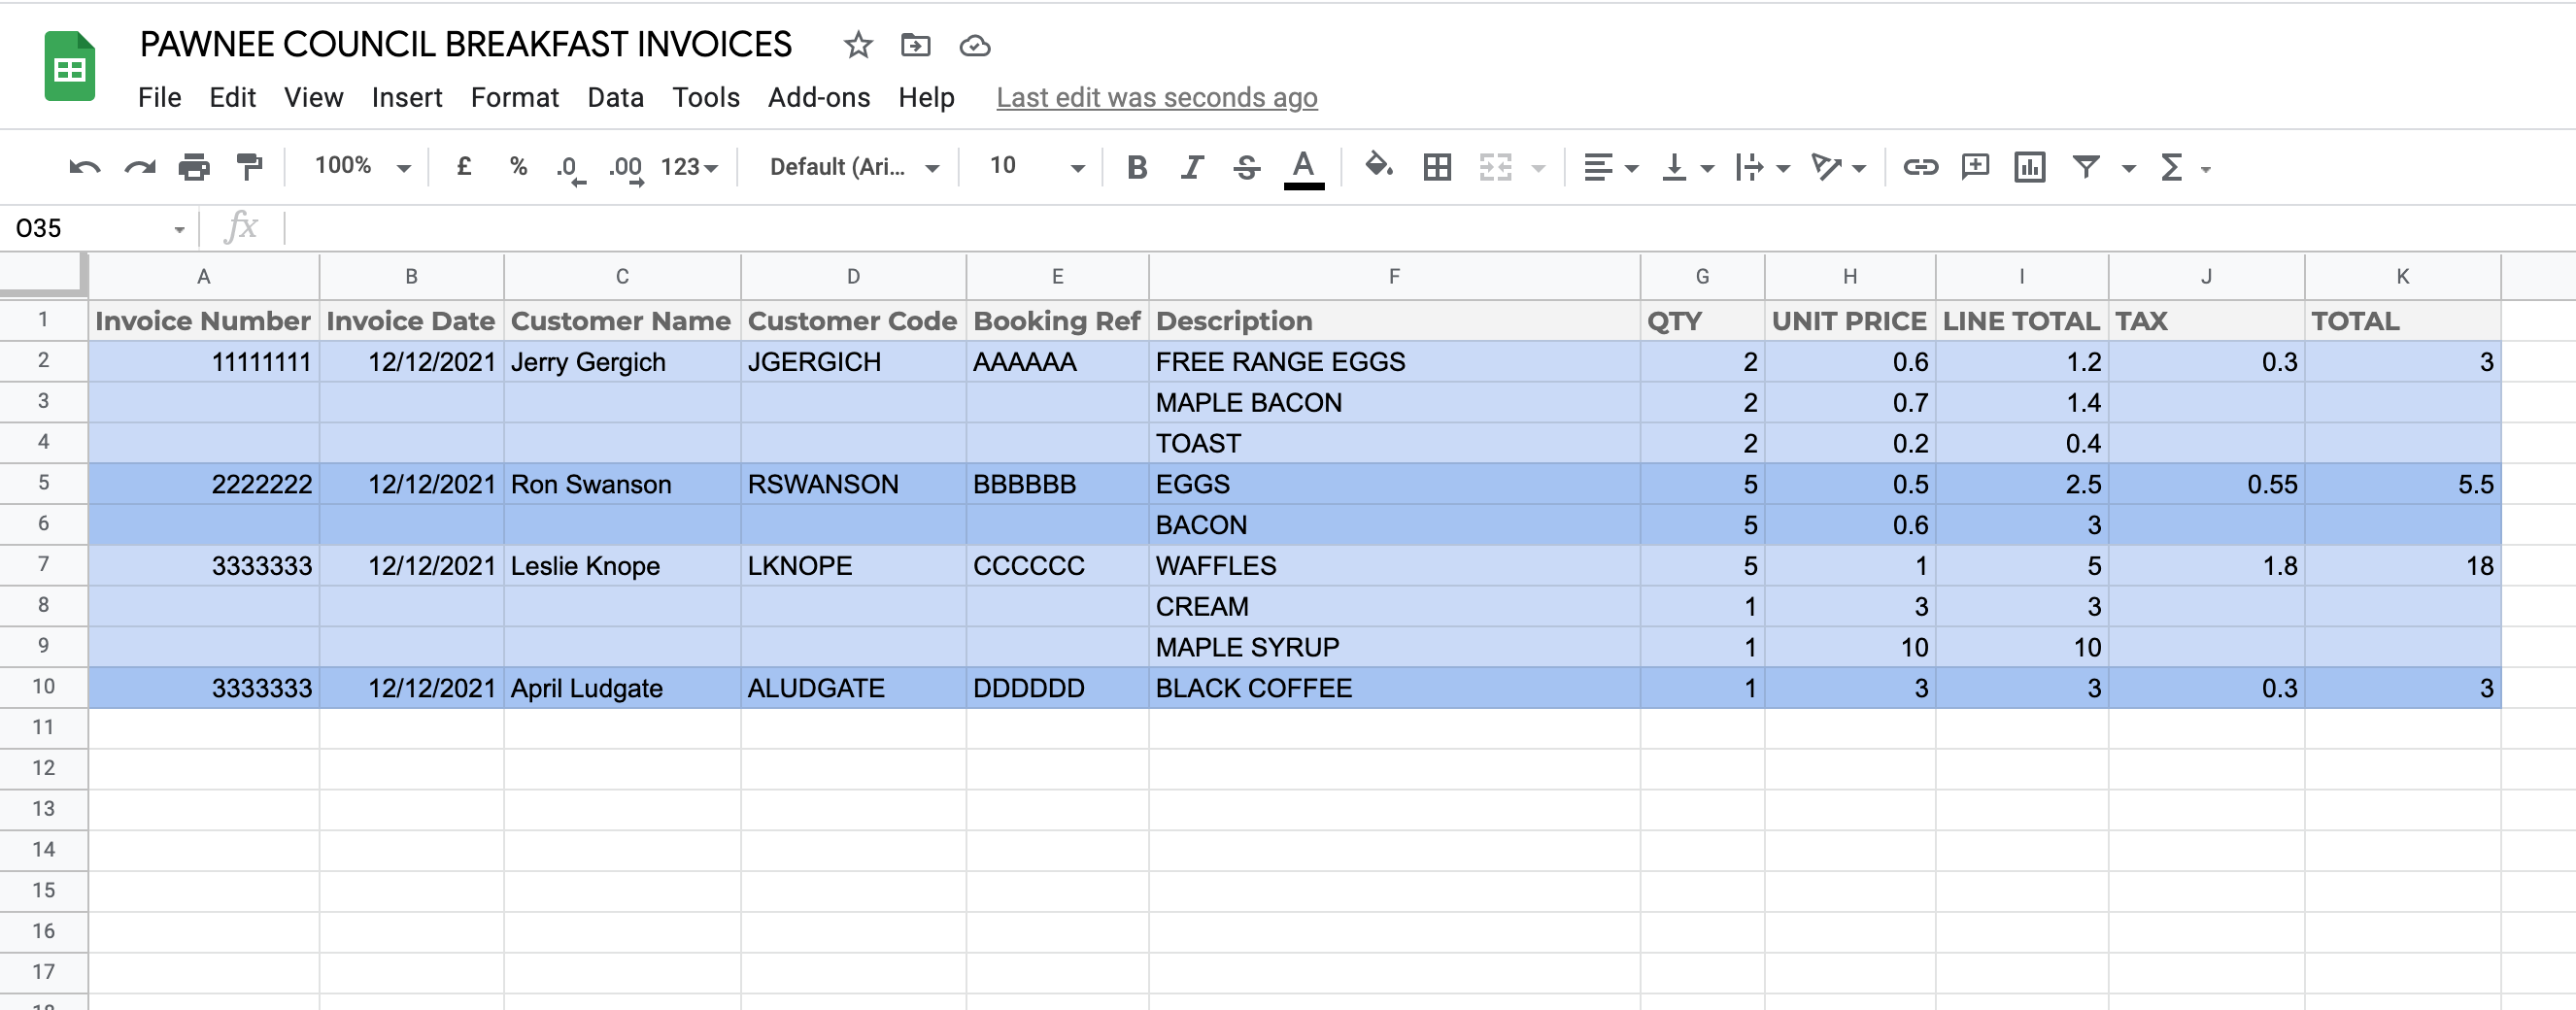
A typical example: your source spreadsheet has one row per invoice line, and several rows share the same invoice number. Without grouping, Portant would generate one document per row. With grouping, Portant produces one document per unique invoice number, with all the matching rows listed in a table inside it.
The same idea applies to:
- A purchase order with multiple items per supplier
- A statement with multiple charges per customer
- A timesheet with multiple entries per project
- A QBR with multiple deals per account
Setting up grouping
Step 1: add a table to your template
Insert a table in your document where the grouped rows should appear (Insert > Table).
Data grouping also works inside Google Slides templates.
You can add header rows above and footer rows below. The header and footer rows stay in place; only the row that contains tags expands.
Step 2: add the line item tags
Add the tags for the fields that should repeat into a single row of the table. All line item tags must be on the same row, otherwise Portant won't recognise the repeating pattern.
Step 3: choose the column to group by
Open Data Merge Options > Data grouping and pick the column that identifies which rows belong together. In the invoice example, that's the invoice number column.
The grouping column needs to identify each group uniquely. If two columns have similar names (Invoice Number and Invoice No.), pick the one with the values you actually want to group by, and rename the other so it's not confused.
Step 4: run the workflow
Once grouping is set, every unique value in the grouping column produces one document. Rows that share the same value are combined into the table inside that document.
Set up the rest of the workflow as usual (output name, PDF, email) and click "Create Documents". You'll get one document per group, with the matching rows listed in the table.
Totals and other calculations
Once the rows are grouped, you can add a totals row beneath the repeating row using tag formulas:
{{=SUM(Field name)}}adds the values{{=AVG(Field name)}}averages the values{{=MAX(Field name)}}returns the largest value{{=MIN(Field name)}}returns the smallest value
These formulas only operate on grouped fields.
Notes and constraints
- Data grouping is only available in "Create multiple documents" mode. Switch to that mode in the Data Merge box.
- The grouping column needs to be present and consistent across rows that should end up in the same document.
- Header and footer rows in the table are preserved as-is. Only the row containing the tags is repeated.
Source-specific recipes
The mechanic above is the same everywhere. The recipes below cover how to set up grouping for each source:
- Google Sheets data grouping
- HubSpot: add multiple line items into a single document
- Webhook data grouping